Find out who your customers are, how they buy, where they drop out and where you are missing opportunities. This dashboard gives you a 360° view of customer behavior, performance and trends. From KPIs to maps - everything is connected and ready for action.
Link ticket, store and customer data into one 360° view of each sale.
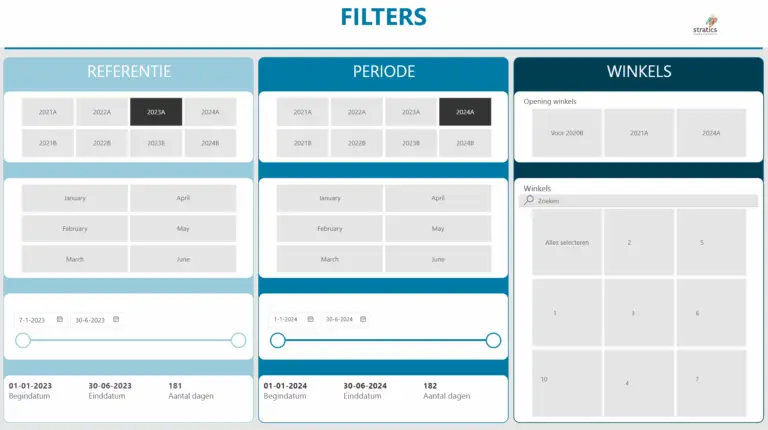
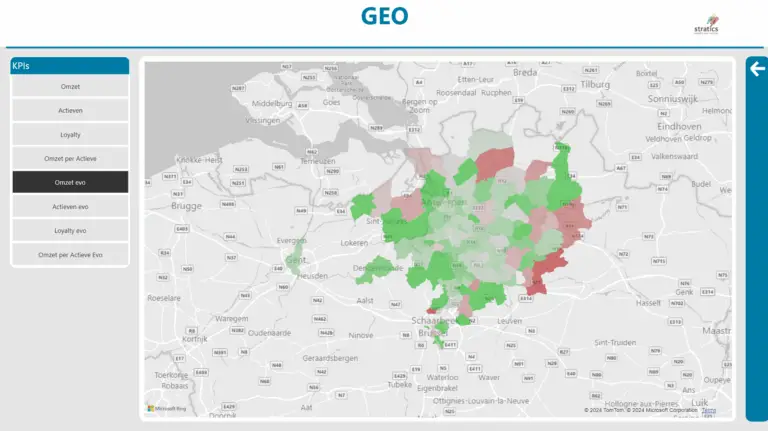
Filter, benchmark and deep-dive down to profile, store or region in one click.
Spot real-time trends and anomalies and turn them into action immediately.


The dashboard is fully embedded in myMIP: you open it from the same environment in which you manage campaigns, segments and flows, without leaving the familiar interface. This way you switch smoothly from insight to action, with all functionality in one place.
With intuitive sliders and context-sensitive dropdowns you select a period, store, campaign or segment in seconds, after which all graphs and KPIs move along in real-time. This way you don't waste time searching but zoom in at lightning speed on opportunities and bottlenecks that matter.
Switch effortlessly from store to segment, region or channel; the dashboard instantly redraws itself around your chosen angle.
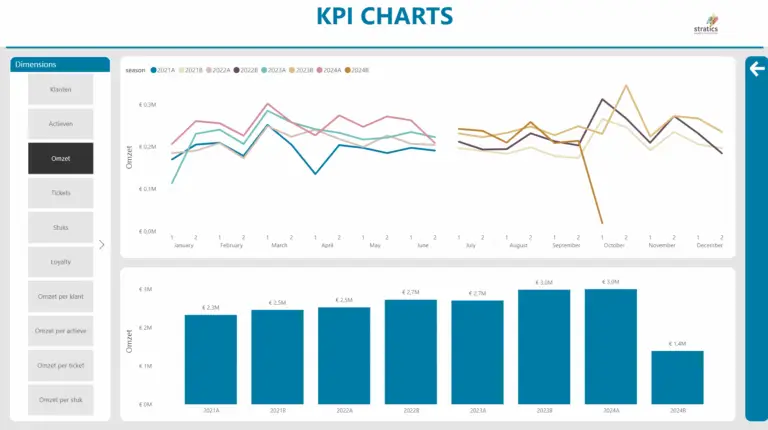
With one click, put the KPI that matters front and center - revenue, margin, CLV, whatever you need - and all visuals follow automatically.
See instantly how your campaign scores versus previous periods or automatically calculated internal benchmarks; deviations light up so you can make adjustments immediately.
Each diagram responds instantly to your selection: click on a bar, line or map point and all other visuals instantly redraw themselves. This way you effortlessly navigate from overall view to detail level and back again, without ever leaving the dashboard.
Every moment our pipelines fetch the latest transactions, contact updates and campaign results. So the next time you log in, you're always working with the most up-to-date numbers.
Outdated exports or manual uploads are a thing of the past. With every refresh an automatic quality check runs, so you can base your decisions on fresh and reliable data.
The standard dashboard already covers many basic needs, but sometimes you want just that little bit extra. Together we look at which dimensions, KPIs or visualizations really help your organization. Think of your own segmentation logic, industry-specific benchmarks, extra data links or an entirely new report page.
In a short workshop, we capture your requirements, after which our consultants extend the dashboard and immediately integrate it into your familiar myMIP environment.
That way you don't get a one-size-fits-all, but a solution that fits your goals and workflow exactly.